Writing Task1의 원그래프 쓰는 법을 연습합니다.
연습은 총 3단계로 진행됩니다.
1단계-모범 답안 연습
2단계-문장 쓰기 연습
3단계-전체 쓰기 연습

Writing Task1의 원그래프 쓰는 법을 연습합니다.
연습은 총 3단계로 진행됩니다.
1단계-모범 답안 연습
2단계-문장 쓰기 연습
3단계-전체 쓰기 연습
대표 문장 연습입니다.
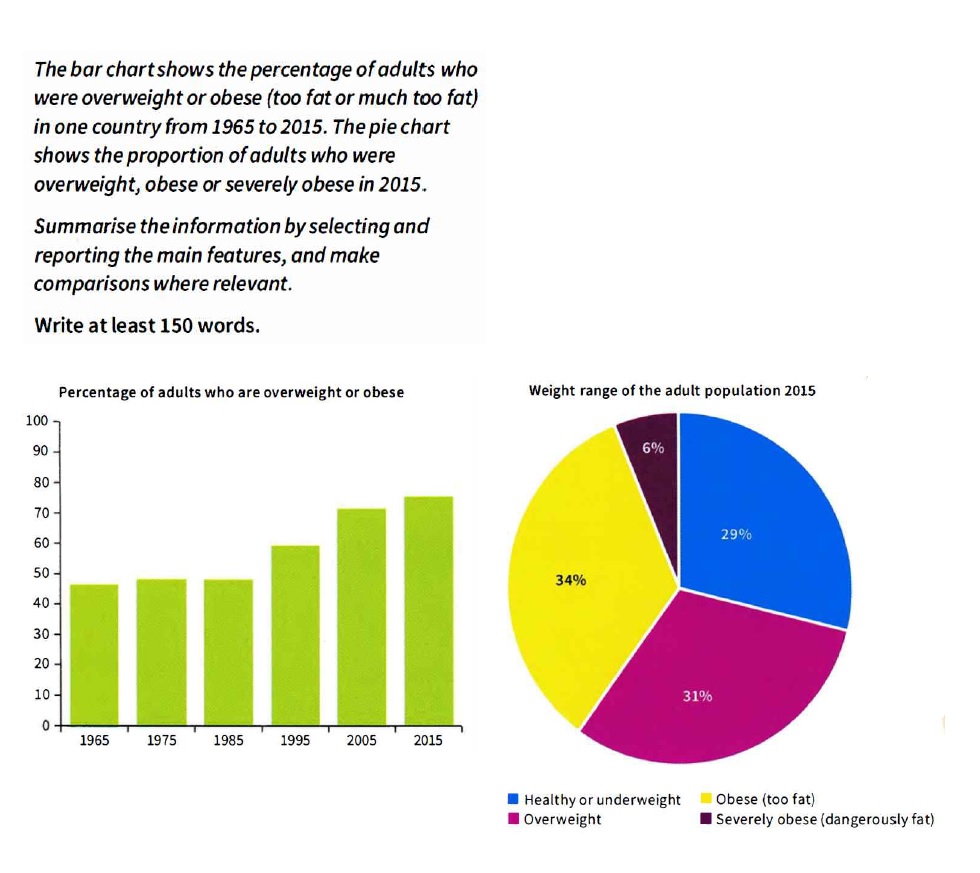
The bar chart shows the percentage of the adult population who were overweight or obese between 1965 and 2015, while the pie chart shows the percentage of people who were a healthy weight, overweight, obese and severely obese in 2015.
The rise in the number of people who are too heavy was gradual from 1965 to 1985. The first significant increase occurred between 1985 and 1995, from around 48% to almost 60%. In the next ten-year period there was a similarly large rise. By 2005, approximately 70% of people weighed too much. The upward trend continued into the 21st century but at a slightly lower rate.
The pie chart confirms that in 2015 over 70% of adults were too heavy, and it also gives more detail about how much they were overweight. Only 6% of people were so overweight that their health was seriously at risk, i.e. severely obese. The remaining people were divided more or less equally between the other groups.
(162 words)
<연습장>
1)The bar chart shows the percentage of the adult population who were overweight or obese between 1965 and 2015, while the pie chart shows the percentage of people who were a healthy weight, overweight, obese and severely obese in 2015.
2)The rise in the number of people who are too heavy was gradual from 1965 to 1985.
3)The first significant increase occurred between 1985 and 1995, from around 48% to almost 60%.
4)In the next ten-year period there was a similarly large rise.
5)By 2005, approximately 70% of people weighed too much.
6)The upward trend continued into the 21st century but at a slightly lower rate.
7)The pie chart confirms that in 2015 over 70% of adults were too heavy, and it also gives more detail about how much they were overweight.
8)Only 6% of people were so overweight that their health was seriously at risk, i.e. severely obese.
9)The remaining people were divided more or less equally between the other groups.
Task1 한 문장을 연습하는 포스팅입니다. 이곳에 올라오는 포스팅에 댓글을 이용해서 1문장을 연습하세요.
| 제목 | 작성일 |
|---|---|
|
10.Task1 문장연습_지도_body1
|
2021.08.18 |
|
9.Task1 문장연습_지도_Overall2
|
2021.08.18 |
|
8.Task1 문장연습_지도_overall
|
2021.08.18 |
|
Task1 문장연습_지도_intro
|
2021.08.18 |
|
6.IELTS Task1 문장암기_꺾은선_body3
|
2021.08.17 |
Task1 기출문제를 보면서 전체 답안을 작성합시다.
| 제목 | 작성일 |
|---|